[Brenner
Computational Biology Research Group][Ed
Green]
Pairwise Sequence Comparison Evaluation
Introduction
Pairwise
sequence comparison is the workhorse method of computational biology.
There are several popular programs available for doing pairwise database
sequence searches, like BLAST
and FASTA. We would
like to understand how well these methods perform relative to one another
and in an absolute sense. 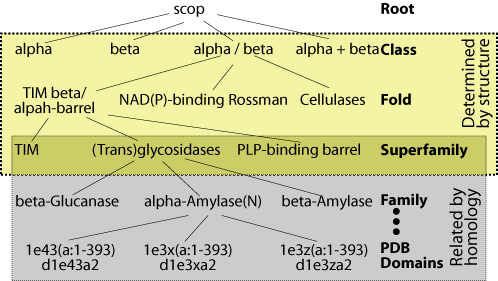
Additionally, we would
like to know how best to use these methods in terms of user defined parameters
and how sensitive each method is to parameter choice (like gap parameters
and substitution matrix).
In order to assess database
search methods, it is necessary to have a test dataset of sequences whose
relationships are known. It is important that this knowledge be derived
independently of the methods being tested. We use the structurally
and evolutionarily derived relationships in the
SCOP
database for this purpose (figure). Specifically, the ASTRAL
database provides SCOP sequences filtered at various levels of sequence
identity. We use the ASTRAL genetic domain database filtered at 40%
identity to make our evaluations specific for remote homologs. Sequences
that are classified in the same superfamily are related both structurally
and evolutionarily. Therefore, our tests evaluate a given method's
ability to find the relations between superfamily members.
Methodology
Analyzing the results of
a database search is always a matter of finding the best compromise between
sensitivity and specificity. A given database search will likely
yield a handful of very similar sequences that are homolgous and a larger
handful of vaguely similar sequences some of which may be homologous.
Homology (one of the most commonly misused words in biology) means sharing
a common ancestor. Two sequences are homologous if there was a single
sequence that gave rise to them both through duplication and divergence.
If there is enough similarity between two sequences to be detected through
pairwise comparison, it is usually safe to infer that they are homologous.
Frustratingly, there are many sequences with little or no detectable similarity
that really are homolgous.
A good search method
will find as many of the true homologs as possible in a database while
cleanly separating them from the non-homologs. It will additionally
be coupled to a good statistical scoring method that accurately reports
how likely it is that any given match arose purely by chance and not because
the sequences are really related.
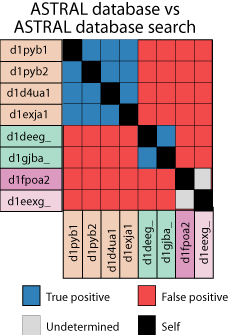
In order to assess
database search methods, we perform a database vs database search with
our test sequences, derived from the ASTRAL database (figure). That
is, we take each sequence, one by one, and use it as a query sequence to
search the database. All of the hits from all of these searches are
then pooled and sorted from most significant to least significant. Since
we already know which sequences are related, we can then go through this
list and see how many the method being evaluated got right. Ideally,
there would be a clean separation between the true homologs, at the top
of the list, and non-homologs at the bottom. In practice this never
happens.
This data can be rendered
in a Coverage versus Errors per Query (CVE) plot (figure). 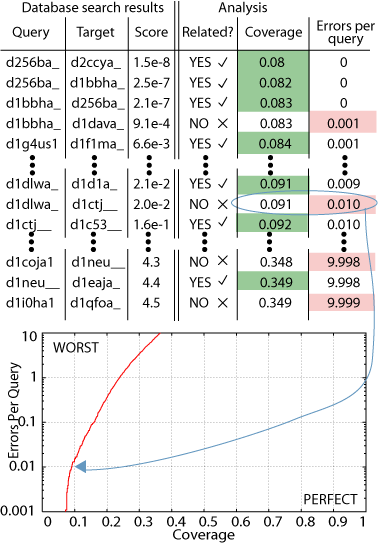 Coverage
refers to how many of the true relations in the database were found.
Erros per query is the number of times a given false relationship was reported,
divided by the number of sequences in a database. The sorted list
of all database search hits is traversed and at each significance level,
a point on the CVE plot is generated. Looking at the CVE plot in
the figure, you can see that as the coverage increases (as you find more
homologs), the number of errors increases. This is what is meant
by a compromise between sensitivity and specificity.
Coverage
refers to how many of the true relations in the database were found.
Erros per query is the number of times a given false relationship was reported,
divided by the number of sequences in a database. The sorted list
of all database search hits is traversed and at each significance level,
a point on the CVE plot is generated. Looking at the CVE plot in
the figure, you can see that as the coverage increases (as you find more
homologs), the number of errors increases. This is what is meant
by a compromise between sensitivity and specificity.
CVE results from any
two database search methods (or parameter sets, or scoring schemes, etc.)
can be compared but it is not immediately obvious how significant any performance
difference may be. To address this question, we use a technique pioneered
by Brad Efron known as bootstrapping (figure). Bootstrapping is a
method for estimating the distribution from which a given statistic derives,
even when you can not resample from the population again. That is
exactly the problem we are faced with here. There is a population
of protein sequences out in nature and only a small fraction are sampled
in the ASTRAL database. We can't easily throw out the ASTRAL database
and have new ones generated. If we could, we would do that and recalculate
CVE statistics for each one and then see its distribution directly.
Instead, we bootstrap the data we do have. That is, we resample it
by making new databases that derive from the original database. These
resampled databases have the same number of sequences as the original database,
but each sequence is represented a random number of times.
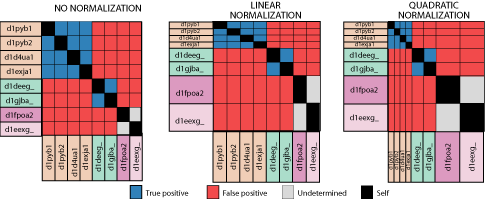
Another consideration
in these analyses is that of the representational biases within our test
set. Since our test sequences derive from solved structures, this
problem is particularly acute. Only sequences that are amenable to
structure determination and deemed interesting research subjects have their
structures solved and make their way to the ASTRAL database. The
ASTRAL database, filtered at 40% identity has a few very large superfamilies,
like the immunoglobulins, and very many smaller superfamilies. To
address this problem, we can normalize results by superfamily size, downweighting
those that are in larger superfamilies. We employ two approaches
to this. Linear normalization downweights each correctly identified
relation in linear proportion to its superfamily size. In this way,
larger superfamilies still contribute more to the overall results, but
less than in unnormalized results. The other normalization scheme,
quadratic normalization, weights the results from each superfamily equally,
regardless of its size.
Results
Great, so which pairwise
method is the best? Well, it depends. The SSEARCH program,
is a full implementation of the Smith-Waterman local alignment algorithm.
It is guaranteed to find the optimal alignment under a given scoring scheme.
The hueristic methods, like BLAST, run faster, but miss some of the best
alignments. 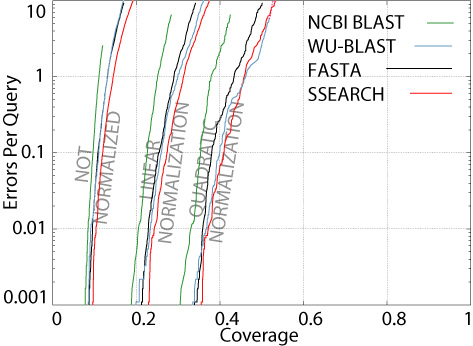 Therefore,
they do not perform as well in CVE analysis.
Therefore,
they do not perform as well in CVE analysis.
The figure shows a CVE
plot of four popular pairwise search programs, using parameters optimized
for this test (see the "Bootstrapping
and Normalization for Enhance Pairwise Sequence Comparison" manuscript
for details). As you can see, all four methods fail to detect the
majority of the evolutionary relationships in the database. This
is what is meant by understanding how well the programs perform in an absolute
sense. If our test database is anything like the real sequence databases
biologists use (like GenBank),
this means that when one does a database search, most of the sequences
that are really related can't be detected. So, here's a good take-home
message: If you clone and sequence a new gene, BLAST it against GenBank
and fail to find any significant hits, do not write in your paper
that your sequence is not homologous to any other known sequence.
It very well may be, but you just can't detect it.
Another interesting
observation is that for all four methods, if we normalize the results,
the coverage increases. This means that when results from large superfamilies
are discounted, the situation improves. Therefore, the pairwise relations
in larger superfamiles are more difficult to detect, on the whole, than
those in smaller superfamilies, in the ASTRAL database. Why should
this be the case? I do not know.
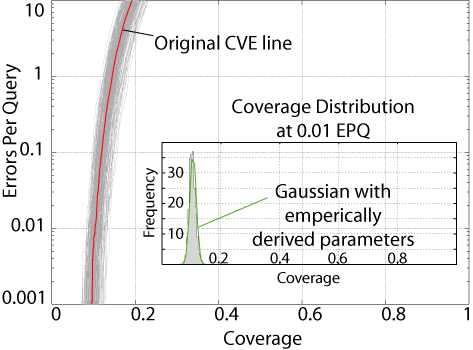
Using the bootstrap
procedure we can determine whether the coverage difference we observe at
a given error rate is significant. The figure to the right shows
the 200 CVE lines generated when we bootstrap resample the database 200
times. Overlayed is the Original CVE line, that is, the CVE line
from the unbootstrapped database. As you can see, the resampled databases
are distributed around the original line. The inset shows a histogram
of the 200 bootstrap coverage values at 1% error rate. If you calculate
the standard deviation of these values and plug that into the Guassian
formula, bootstrap theory predicts that it should fit the actual data pretty
well. Looks like it does.
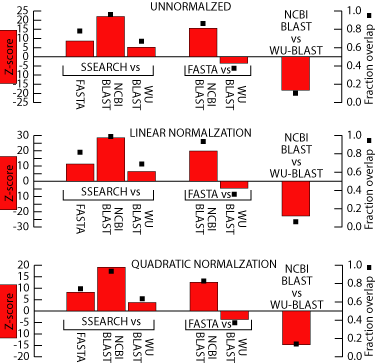
This is a figure showing
how significant the differences between these methods are. The left
axis is the Z-scores of a two sample parametric means test between the
two methods using the bootstrapped standard error. Generally, a Z-score
whose absolute value is greater than 2 or 3 means that two values are significantly
different. Therefore, it looks like SSEARCH generates results that
are significantly better than the heuristic methods. The right axis
is the fraction overlap between the two bootstrap distributions.
This is a simple metric meant to give a general sense of how the two bootstrap
distributions compare. It is generated by randomly drawing from one
of the 200 bootstrap distributions of both methods and checking which had
the greater coverage. This is repeated 1000 times. If the two
distributions are equal, then the randomly drawn value from either one
will be greater than the randomly drawn value from the other about half
the time. This would be a fraction overlap value of 0.5. As
you can see, this statistic roughly mirrors the Z-score of the two-sample
parametric means test.
Data and Tools
The datasets used
in these evaluations derive from ASTRAL
and up to date versions can always be obtained there. You can also
get the
tools and datasets for sequence comparison, as used in "Bootstrapping
and normalization for enhanced evaluations of pairwise sequence comparison".
To learn more...
The
CVE plot was introduced in "Assessing sequence
comparison methods with reliable structurally identified distant evolutionary
relationships". The bootstrapping and normalization of pairwise
comparison results is presented in "Bootstrapping
and normalization for enhanced evaluations of pairwise sequence comparison".
Georg Fuellen put together
a very nice BioComputing
Hypertext Coursebook. It has a chapter on pairwise sequence alignment.
Keith Robinson made an introduction
to sequence analysis.
About the author
My
name is Ed Green and
I'm a grad student in Steven Brenner's
group. I'm in the MCB
program at UC Berkeley. I'm
interested in developing and evaluating sequence analysis methods and understanding
alternative splicing. Feel free to email me at ed@compbio.berkeley.edu